
Industrial Automation
i-Perform is L7 Systems’ Flagship which has been developed over the years with the objective as Operational Support System (OSS) platform. OSS was originally created in Telecom Industry to manage various heterogeneous equipment and devices and complex processes to deliver communication services to millions of customers.
Over time OSS platform has been widely adopted and successfully deployed in many industries outside of Telecom.
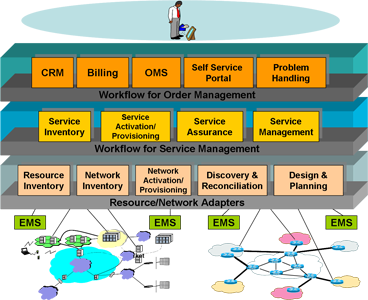
i-Perform OSS is built with 3 layer concept as show in the above figure:
- Customer-centric Layer: the OSS top layer is built to handle customer related tasks such as Billing, Customer Relation Management, Problem Handling or Self-Service Portal. This is the layer that customers see and will have experience from
- Service-centric Layer: the middle layer focuses more on services that a corporation delivers to customers. Primarily, it will manage and monitor its services, e.g. activation/deactivation, service quality and assurances. Most corporations today start to put efforts in understanding the importance and the role this layer plays in their operation bottom line
- Network or resource-centric Layer: the bottom layer deals directly with network, corporation’s resources such as devices and equipment. Several modules will have to be implemented and deployed so that OSS can talk and manage the resources.
i-Perform is designed and built with the focus on the bottom and middle layer of OSS stack: Network/Resource- and Service-centric layer. In some exceptional cases, customer related modules or interfaces such as Billing are inserted and built into i-Perform.
Industrial Monitoring and Control
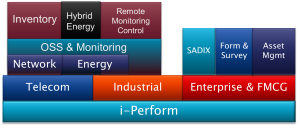
In the above figure, it is shown that i-Perform has been developed and deployed in many industries: Telecom, Industrial and Enterprise (mostly in Fast Moving Consumer Goods or FMCG).
In this paper, we focus our attention on the application, deployment and benefits of i-Perform in Industrial environment. The objective of the paper is to give readers an overview and appreciation in term of how i-Perform has been deployed and what the benefits coming out of the deployment corporations can gain and how i-Perform will be able to monitor and increase operational efficiencies and performance.
i-Perform Look and Feel
The following pictures and diagrams are shown in order to give a better understanding about how i-Perform works and processes and displays some of the results.
In the following set of pictures, maps and monitoring panels of i-Perform are shown where operators can view the status of network resources or remote devices and users will be able to drill down on the map to get to monitoring panel in which measurement results and control buttons are displayed.
The geographical map in i-Perform helps users tremendously in understanding the location and monitoring the health and status of network resources or remote devices.
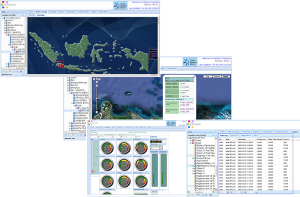
Appropriate actions can be devised when and if specific network devices are deemed to have troubles. In addition to this, Fault and Alarm Monitoring module is embedded in i-Perform whose main task is to monitor or control that specific measurement results are within pre-defined boundaries that can be configured and set in low and high threshold values in i-Perform configuration panel as shown in the following figures.
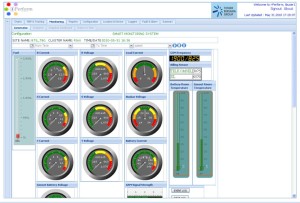
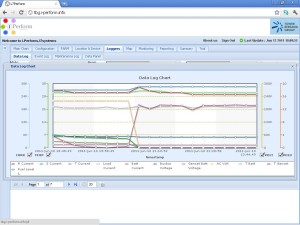
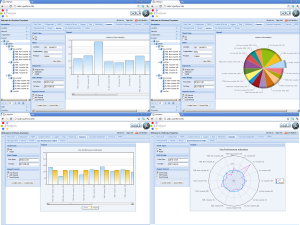
The following diagrams are depicted to help users understand i-Perform graphical diagram/chart and reporting panels. In most cases, corporations would like to understand their operational effectiveness and performance that can be measured in many ways:
- Cumulative numbers of events or items
- Statistical breakdown of pre-defined categories of events or items
- Average, minimum and maximum of collected measurement results
- Key Performance Indicator vs pre-defined Targets
One of the key advantage in using OSS such as i-Perform is that corporations will be able to not only monitor/control network resources in a timely fashion but also to get real-time or semi-real-time performance reports where in the past the data and reports are usually very hard to come by.
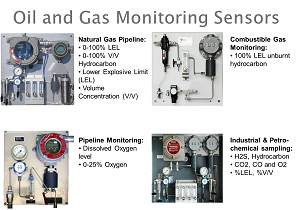
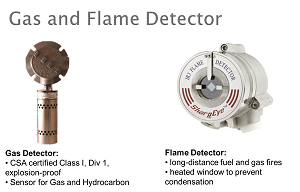
Field Data Capture (FDC) in Oil and Gas Industry
One of applications examples of i-Perform in Oil and Gas Industry is in Field Data Capture (FDC), monitoring and detecting Gas and Flame. For safety purpose it is crucial in oil and gas related fields to monitor for certain gas content: toxic gases, combustible gas. Sensors certified in Oil and Gas Industry are deployed to detect and measure as shown in the figure below.
It is important to note that i-Perform provides the software features and capability and interface to collect and process measurement data obtained and sent by sensors. Sensors can either be newly acquired and deployed or already existing in the field.
Monitoring and Control in Oil and Gas Industry
Another application examples of i-Perform in Oil and Gas Industry is in monitoring and controlling pumpjacks in oil-rich areas. Pumpjacks shown in the figure below are commonly used to mechanically lift liquid out of the well if there is not enough bottom hole pressure for the liquid to flow all the way to the surface. The arrangement is commonly used for onshore wells producing little oil. Pumpjacks produce on average 5 to 40 liters of liquid at each stroke.
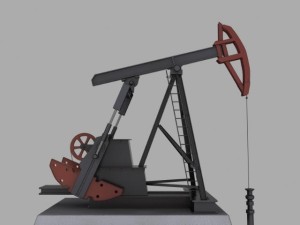
One of the problems that create the need for remote monitoring and control of pumpjacks is the inconsistent or variable bottom hole pressure. When the pressure falls under certain threshold, the pumpjack should be turned off to prevent any potential and long-term damage to the pump and in turn to save energy as the pump will not be able to produce economically viable liquid at each stroke. The pumpjack should be turned on again when the pressure goes above configured threshold. That is the one of the objectives to control the pump.
As pumpjacks are installed in geographically dispersed areas, the need arises to monitor all or most of the deployed pumpjacks so that operators would accurately know the health and status of the equipment.
Automation and Control
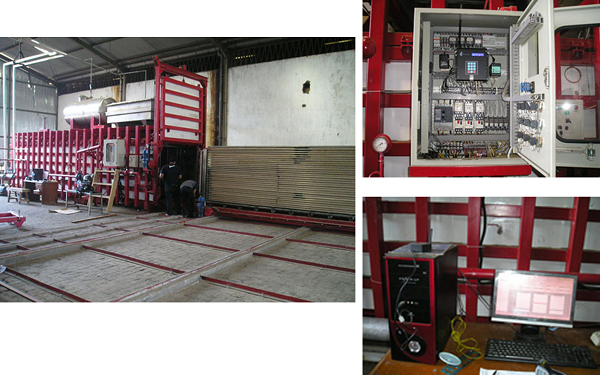
The above figure shows a good example where i-Perform in conjunction with PLC (Programmable Logic Control) has been deployed in Wood Industry. PLC was developed to control the kiln dry wood equipment.
The primary function of the machine is to bring down the wood water content from high 70% or 80% down to 3% to 5% while protecting the wood from drying too fast that can cause cracks or wrapping and at the same time drying the wood as fast as the machine can to reduce energy consumption. It will take several days to kiln-dry wood to allow further processing such as cutting, glueing and varnishing to get to final products. This process takes significant amount of energy so that a few percentage of energy reduction will result to significant cost reduction in term of cost and time.
It is a closed loop systems whereby PLC must measure the temperature, pressure and humidity within the wood drying chamber. It will also collect water content in the wood. I-Perform and PLC must also maintain a number of recipes or programs designed to kiln-dry specific wood types such as Oak, Maple and others.
Improvement were designed and built into the wood drying machine such as more flexible chamber to allow much lower air pressure as well as flexible control and monitoring PLC and i-Perform so that operators can reduce the time to dry the same tonnage of woods from an average of 7 days down to 3 or 4 days. This constitutes of time and energy saving of 50% to 60% so that the company was able to substantially lower the production cost.
Production and Energy Monitoring
Another example of i-Perform application in Industrial environment can be found in Production Monitoring in which either PLC or sensors are installed to measure, count and monitor production lines.
Many sensor or transducer types can be deployed in conjunction with i-Perform and the most common types are:
- Temperature sensors to measure ambient temperature or temperature sensitive machines or items
- Counting sensors to count products, persons or items
- Energy sensors to measure Voltage, Current and kWH/kVA or Power Factor which is an indicator for energy efficiency
- Timers to measure the speed or intervals of production elapsed times
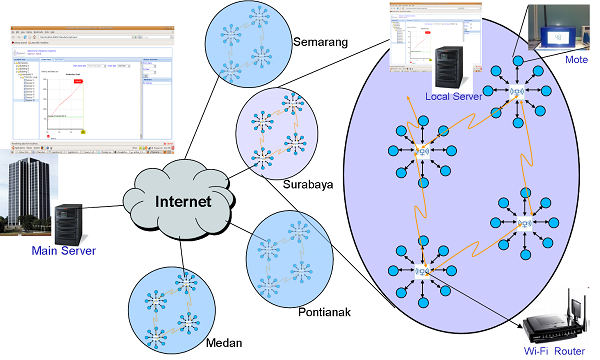
For i-Perform to work seamlessly across many boundaries such as geographical location, buildings and rooms, we build communication networks to enable control, monitoring data and measurement results can flow within the corporation as shown in the following figure. In that figure, VPN (Virtual Private Network) is built to connect many remote locations and HQs and within a specific location an Intranet for i-Perform is purposely built to allow data collection as well control command transfer to flow.
Conclusions
In this paper, we walked through from i-Perform OSS concept to i-Perform OSS application areas. The emphasis is in the understanding of i-Perform’s industrial application and benefits. With the i-Perform reporting modules, readers should be able to see how we can gain insight into company’s operational efficiency and performance that has never been possible prior to i-Perform deployment. One should also appreciate the significant advantages companies can gain from real-time data collection, monitoring, control and last but not least reporting in decreasing the turn-around or reaction time and hence increasing production efficiencies.
Please contact us for further detail and risk-free pilot and deployment !