
Automation and Control System
i-Perform Operational Support Systems (OSS)
i-Perform has been designed and built for Operational Support Systems (OSS). OSS can be loosely defined as computer systems used by telecommunications service providers. The term OSS most frequently describes “network systems” dealing with the telecom network itself, supporting processes such as maintaining network inventory, provisioning services, configuring network components, and managing faults. The complementary term Business Support Systems or BSS is a newer term and typically refers to “business systems” dealing with customers, supporting processes such as taking orders, processing bills, and collecting payments. The two systems together are often abbreviated BSS/OSS or simply B/OSS.
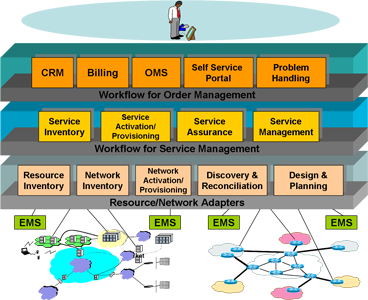
Figure 1 depicts layer structure that forms BSS/OSS where business applications such as CRM, Billing, Order Management Systems (OMS), Self Service Portal and/or Problem Handling Systems form the top layer. The top layer is definitely closely related to the BSS. The middle layer consists mostly of service-oriented applications that enable service creation, service activation/provisioning , assurance as well as management. The bottom layer deals directly either with network equipment, networks or EMS/NMS (Element Management Systems/Network Management Systems).
i-Perform as Monitoring and Control Systems
In Telecommunication there are many scenarios in which i-Perform can be deployed. In this paper, we discuss two distinct applications:
-
Monitoring wireless base station: i-Perform’s task is to enable remote monitoring of important events in wireless base stations that are usually situated in many remote locations whether in cities or rural areas. With i-Perform, Telecom operators can easily maintain, detect important events that are common such as door opened or closed, temperature within the shelter or outdoor BTS (Base Transceiver Station). For areas where theft is prevalent, vibration or motion sensors can be installed so that we can detect uncommon events such as excessive vibration or motion inside a particular shelter. Figure 2 shows the logical overview of i-Perform operation for wireless BTS monitoring.
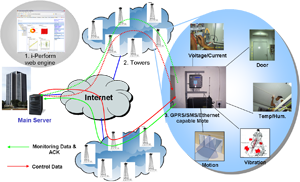 Figure 1 BSS/OSS Stack
 -
Another important application for i-Perform is to monitor power for central exchanges and remote stations such as wireless BTS. i-Perform’s task in this application solely focuses on power such as AC power systems – either 1 or 3 Phase – , DC power system such as rectifier modules and battery banks. It is important to note that temperature is an important factor in maintaining battery MTBF (Mean Time Between Failure) so that i-Perform monitors temperature such as room and battery temperature. Power monitoring operation is depicted in Figure 3.
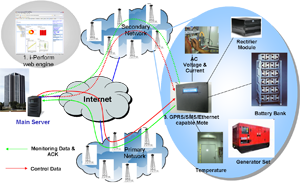 Figure 3 i-Perform for Power-Monitoring
i-Perform Operational Overview
As discussed previously there are many i-Perform applications as discussed above – see Figures 2 and 3. The commonalities between the above applications are the step-by-step i-Perform operation:
- In each location, a Mote or RTU (Remote Terminal Unit) is installed that has either interfaces either via wireless (GPRS or SMS) or Ethernet. The mote is responsible for data collection and transmission of all connected sensors such as temperature, voltage or current sensors. It regularly collects and sends data to the server via wireless (GPRS, SMS) or Ethernet interface. i-Perform’s mote can also be optionally equipped with dual internal wireless modems to provide link redundancy to the server. The mote sends data over the primary wireless interface and if the data transmission failed through the primary interface, it then tries to send the data through the secondary wireless interface. At this time, there is a switch between primary and secondary links. This mechanism is implemented to provide higher link resiliency in case of primary wireless interface failure or primary network failure.
-
Upon receipt of data from a particular mote, the server’s first task is to scan data for the following information:
- Whether the data is valid
- The sender is registered in the i-Perform inventory
- Put a timestamp on the incoming data and store in the database
-
In addition to the data transmission from mote to server, it is also possible for server to control and send commands to each installed mote:
- Reboot and reset mote
- Switch On/Off digital I/O or connected device
- Change configurable parameters such as Rx and Tx time intervals
i-Perform Mote Specification
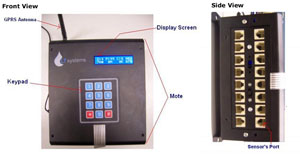
One of the key component in i-Perform operation is the so-called mote or Remote Terminal Unit (RTU). A mote consists of a micro-processor and several digital and analog I/O (Input and Output) shown in Figure 4:
- 8-bit u-Processor
- 16 Analog I/O
- 16 Digital I/O
- i-Perform Firmware
- USB interface that can be connected to a PC for configuration
- Optional One or two internal wireless interfaces (GPRS and SMS capable modem)
- Optional 10/100 Mbps Ethernet interface
Mote H/W Specification:
- Input Voltage: 7-9 VDC, 2 A (18W)
- Optional class-10 GPRS modem
- Storage temperature: -40˚C to 85˚C
- Operating temperature: -30˚C to 70˚C
- Humidity: 0-85% non-condensing
- Dimension LxWxH: 18 cm x 16 cm x 9 cm
- 16×2 character LED
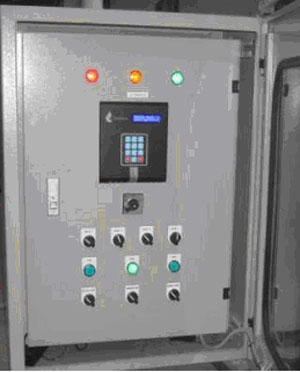
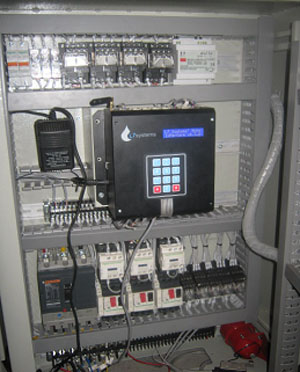
Installation example is shown in the following figure where we can see a mote is installed to control and monitor power system:
i-Perform Features, Architecture and Specification
In order to deploy and efficiently operate a large number of monitoring/control motes in the field, operators have to be able to monitor the health status of each system and control its operation from the main Network Monitoring and Operation Center (NMOC).
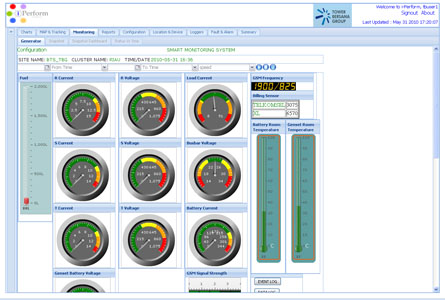
We use i-Perform Software, a web-based monitoring and control software to enable us to oversee the whole operation instantly and on a real-time basis as seen in Figure 6:
-
Map-based overview with the location and status of each hybrid generator as shown in Figure 7 and Figure 8 where we can see using interactive Geographical Map Software the location and status:
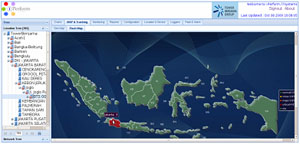 Figure 6 i-Perform Monitoring Panel
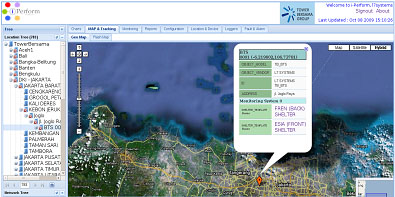 Figure 6 i-Perform Monitoring Panel
 - Drill-down capability to each monitored/controlled system and moreover down to each sensors installed in the systems of interest as depicted in Figure 4
-
To further enforce the monitoring and control capability, i-Perform S/W gives users the capability to drill down the history what had occurred in the systems by using Event and Data Logger with several thousands of entries up to several months of historical data each with unique timestamps as Figure 9 shows.
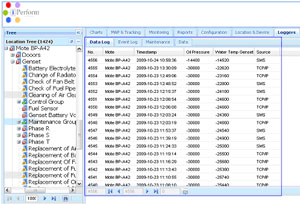 Figure 9 i-Perform’s Data Log Panel
 - Fault and Alarm: one of the most important i-Perform features is Fault and Alarm in which administrators will be able to configure the type of events, threshold to control alarms and notification to whom the alarm to be sent to
Conclusions
Several aspects have been discussed above and to conclude the discussion, we would like to highlight a few key points:
- Ease of use: i-Perform a web-based system that allows users to use thin clients such as Internet Explorer or Firefox to control and monitor remote systems
- Scalability: i-Perform is built on top of J2EE platform which is de facto industry standard for web-based platform running on Linux, Sun Solaris, Windows and many other OS platforms. With i-Perform design and architecture built on top of J2EE platform and Databases such as Oracle, Postgres and mySQL, we ensure i-Perform’s scalability for most Telecom applications
- Flexibility and Integration: with the standard platform, it gives flexibility to S/W developers and IT administrators to integrate i-Perform with other S/W applications such as Network Inventory Management.
Please contact us for further details !